Analysis ToolPak in Excel
The Analysis ToolPak is an Excel add-in that provides advanced tools for financial, statistical, and engineering data analysis.
Enabling the Analysis ToolPak Add-in
Enabling the Analysis ToolPak in Excel is quite easy. Follow these steps:
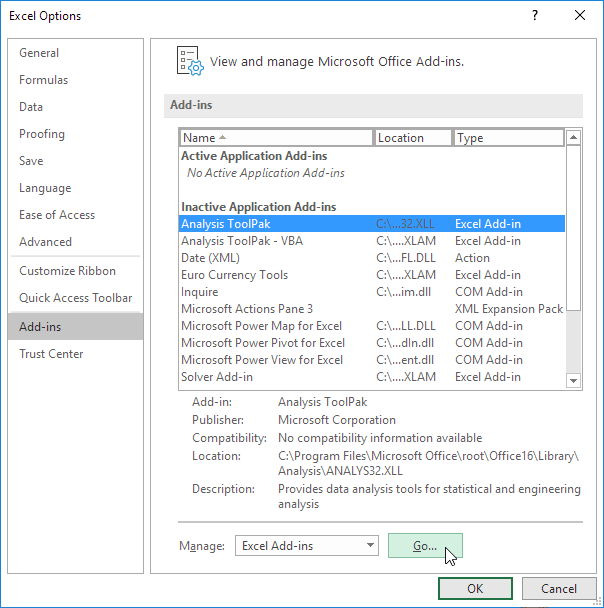
1. From the File tab, select Options.
2. Under Add-ins, choose Analysis ToolPak and click the Go button.
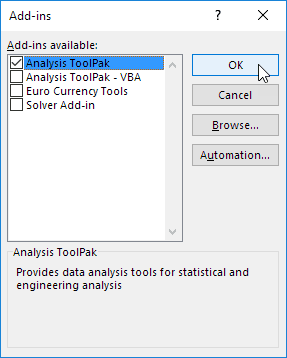
3. Check the box for Analysis ToolPak and click OK.
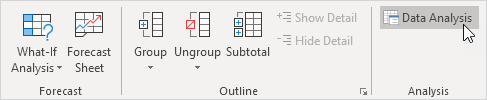
4. Once enabled, go to the Data tab, and under the Analysis group, you will now see the Data Analysis option.
Using the Analysis ToolPak
When you click on Data Analysis, the following dialog box appears.
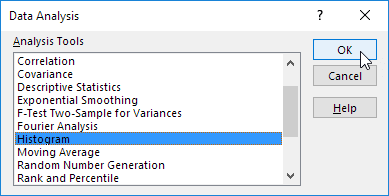
✅ Example: Creating a Histogram in Excel is easy. Follow the steps:
1. Select Histogram from the list.
2. Click OK to generate the histogram.
✅ 1/10 Completed! Know more on Analysis ToolPak ➝
Next Chapter: Create a Macro