What-If Analysis in Excel
What-If Analysis in Excel allows you to test various values (scenarios) within formulas. The following example will help you quickly grasp how to perform what-if analysis efficiently.
Example Scenario
Let’s say you manage a bookstore that has 100 books in stock. You sell a certain percentage at the highest price of $50 and the remaining at a lower price of $20.
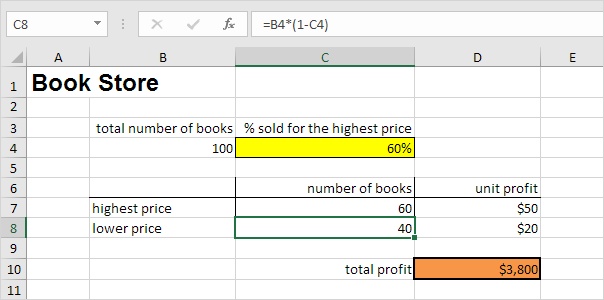
If 60% of the books are sold at the highest price, cell D10 calculates the total profit as:
(60 × $50) + (40 × $20) = $3800
Creating Different Scenarios
What if you sold 70% at the top price? Or 80%, 90%, or even 100%? Each percentage represents a different scenario. You can use Scenario Manager in Excel to build and compare multiple scenarios.
Note: You can manually change the percentage in cell C4 to view the impact on cell D10, but What-If Analysis provides a more structured approach to compare different scenarios side by side.
Steps to Use Scenario Manager
1. 1. Go to the Data tab, then click What-If Analysis in the Forecast group.

2. Select Scenario Manager.
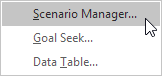
The Scenario Manager dialog box will appear.
3. To create a new scenario, click “Add”

4. Enter a scenario name (e.g., 60% highest), select cell C4 (percentage of books sold at the highest price) under Changing cells, and click OK.
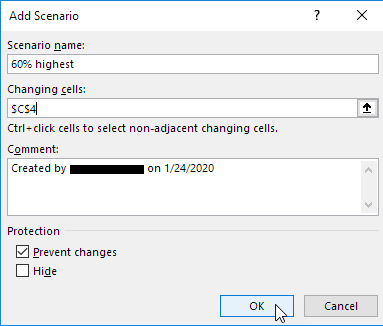
5. Enter 0.6 and click OK again.

6. Repeat these steps to add four additional scenarios: 70%, 80%, 90%, and 100%.
Once completed, your Scenario Manager will look similar to the image below.

Note: To view the outcome of a particular scenario, select it and click Show. Excel will automatically adjust cell C4, allowing you to see the corresponding result on the sheet.
Scenario Summary
To easily compare the results across scenarios, follow these steps:
1. In the Scenario Manager, click the Summary button.
2. Click on cell D10 (total profit) as the result cell, then press OK.

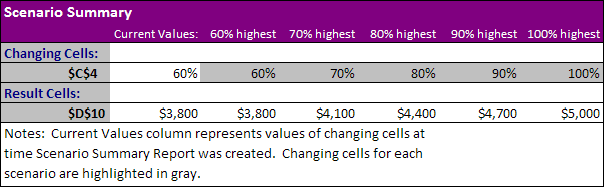
Result:
- Selling 70% at the highest price gives a total profit of $4100.
- Selling 80% at the highest price yields $4400.
- Selling 90% or 100% increases the total profit accordingly.
Conclusion: What-If Analysis in Excel enables quick scenario-based decision-making, helping you evaluate financial outcomes effortlessly.
Goal Seek
Suppose you want to know how many books must be sold at the highest price to achieve a profit of $4700? Excel’s Goal Seek can help you find this value.
Steps to Use Goal Seek
1. Under the Forecast section in the Data tab, click What-If Analysis.
2. Choose Goal Seek.

The Goal Seek dialog box will appear.
3. Select cell D10 (total profit).
4. Enter 4700 in the ‘To value’ field.
5. Choose cell C4 in the “By changing cell” box.
6. Click OK.
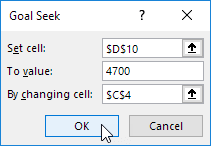
Result: To make $4700 in total profit, sell 90% of the books at the highest price.

Note: For additional insights and advanced techniques, visit our detailed guide on Goal Seek.
✅ 1/4 Completed! Learn more about what-if analysis ➝
Next Chapter: Solver