Tables in Excel
You can manage and analyze data better using Excel tables. Learn how to create, sort, filter, and customize tables for seamless data management.
Create Tables in Excel
Creating a table in Excel is quite easy; just follow these steps:
1. Click on any single cell within the dataset.
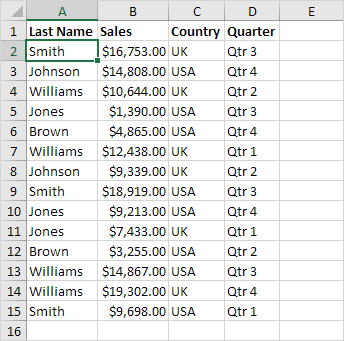
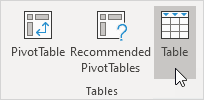
2. Go to the Insert tab, then click Table in the Tables group, or press Ctrl + T.
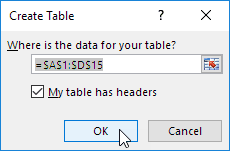
The Create Table dialog box will appear.
3. Excel will automatically detect the data range. Make sure ‘My table has headers’ is checked, then click OK.
Result: Excel organizes data into a table, giving you easy access to powerful features.

Sorting Data in a Table
Follow these steps to organize the table by Last Name and Sales:
1. Click the arrow next to “Sales” and choose “Sort Smallest to Largest.”
2. Click the small arrow next to the “Last Name” column, then choose “Sort A to Z”.
Result: The table is sorted based on the selected criteria.

Filtering Data in a Table
To filter the table and display only data from the USA, follow these steps:
1. Click the arrow next to Country and choose USA.
Result: The table now displays only records related to the USA.

Displaying a Total Row
Use these steps to add a Total Row below the table:
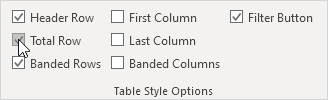
1. Click anywhere inside the table. Open the Table Design tab, go to Table Style Options, and check the Total Row box (or press Ctrl + Shift + T).
Result: A total row is added at the bottom of the table.

2. Select a cell in the total row to calculate Sum, Average, Count, Max, Min, and more for the column. For example, sum the Sales column.

Note: In the Formula Bar, notice that Excel applies the SUBTOTAL function instead of SUM. The SUBTOTAL function (where 109 is used for Sum) ensures correct calculations even when filtering data.
Renaming a Table
Each table in Excel has a unique name that can be used in formulas. To view or modify the table name:
1. Click any cell inside the table. Then, go to the Table Design tab, under the Properties group, to view the table name (e.g., Table1).

2. This formula refers to Table 1 to get the total number of records.

Note: Learn more about structured references in Excel for efficient table-based calculations.
AutoExpansion Feature
Excel tables grow automatically when you add new rows or columns. This helps maintain consistency and ensures that formulas update dynamically.
1. Select any cell inside the table.
2. Use Ctrl + Shift + T to instantly remove the Total Row.
3. Type “Brown” in cell A16, and Excel will format the row according to the table style.

Conclusion: The added row is immediately included in the table, and formulas using Table1 update automatically (check cell G2).
✅ 1/7 Completed! Learn more about tables ➝
Next Chapter: What-If Analysis